

TL;DR
ERCOT battery revenues have collapsed as energy-arbitrage spreads have narrowed, squeezing a source of income that was central to the illustrative unit economics Zach Dell shared on Invest Like the Best in July 2025. Lower installation costs, utility contracts and other revenue sources offer ways to strengthen the business while trading remains weak. How well Base could withstand a prolonged downturn remains difficult to judge without more detail on its current cash flows and financial position.
1. What happened? ERCOT battery revenues collapsed
Units first
Kilowatts (kW) measure how quickly a battery can deliver electricity. Kilowatt-hours (kWh) measure how much energy it holds. A hypothetical 30 kWh battery delivering 10 kW would empty in three hours, ignoring losses and operating limits.
If that battery earns $1,200 annually, that is $40 per kWh of storage capacity, or $120 per kW of discharge capacity. Both figures describe the same annual income; we have just divided it by different measures of the battery’s capacity.
Zach Dell’s July 2025 example used an illustrative assumption of about $40/kWh-year over ten years, or $1,200 annually for a 30 kWh battery. [1]
How batteries earn wholesale revenue
Battery operators earn wholesale income by trading electricity and providing services that help keep the grid reliable.
The trading activity is called energy arbitrage. A battery charges when electricity is cheap and discharges when it is expensive. For example, it might charge during a cheap midday period and sell that electricity during a more expensive evening period.
Operators can also earn income from ancillary services. ERCOT needs resources ready to respond when electricity supply or demand changes unexpectedly. A qualified battery can be paid to keep capability available for that purpose, with requirements governing how quickly and for how long it must respond. [2]
Battery revenues fell about 85%
Modo Energy estimates that average ERCOT battery revenue fell from roughly $190/kW-year in 2023 to $28 in 2025. This includes both energy trading and ancillary services, and describes grid-scale batteries rather than Base’s residential fleet. [3]
Electricity also became cheaper. ERCOT reported average real-time hub prices of roughly $63/MWh in 2023 and $29/MWh in 2024, down 54%. [4]
For arbitrage, though, what matters is the gap between charging and discharging prices. If cheap and expensive hours both rise by the same amount, the average price increases while that gap stays unchanged. We need to look at the spreads available to batteries, alongside what they earn from ancillary services, to understand the revenue decline.
2. Why? More batteries competing for the same opportunities
Ancillary services filled up first
ERCOT’s battery fleet has grown enormously. In his October 2026 Catalyst interview, Modo Energy’s Brandt Vermillion described roughly 17-18 GW approved for commercial operation, compared with only a few hundred megawatts at the start of the decade. [5]
Early batteries earned much of their income from ancillary services. But ERCOT’s need for reserves does not grow in proportion to battery installations. If more batteries offer the same service without a corresponding increase in procurement, they compete to sell a limited amount of reserve capacity and prices fall. Operators then look increasingly to energy arbitrage. [5]
More competition for arbitrage
That opportunity changes as the fleet grows, too. When batteries charge, they buy electricity, which can push up prices during otherwise cheap hours. Discharging adds supply during expensive hours, pushing prices down. Many batteries pursuing the same pattern can narrow the gap between their buying and selling prices. In a September 2026 paper on ERCOT battery storage, Columbia University’s Karl Li finds a narrower evening premium and a flatter midday-to-evening gap in day-ahead prices as battery capacity grows, consistent with that pattern. [6]
The chart below uses public ERCOT real-time prices to measure that gap since 2019. For each day, it takes the average of the two highest hourly prices minus the average of the two lowest. It then averages the result across Houston, North and South, with equal weights. [7]
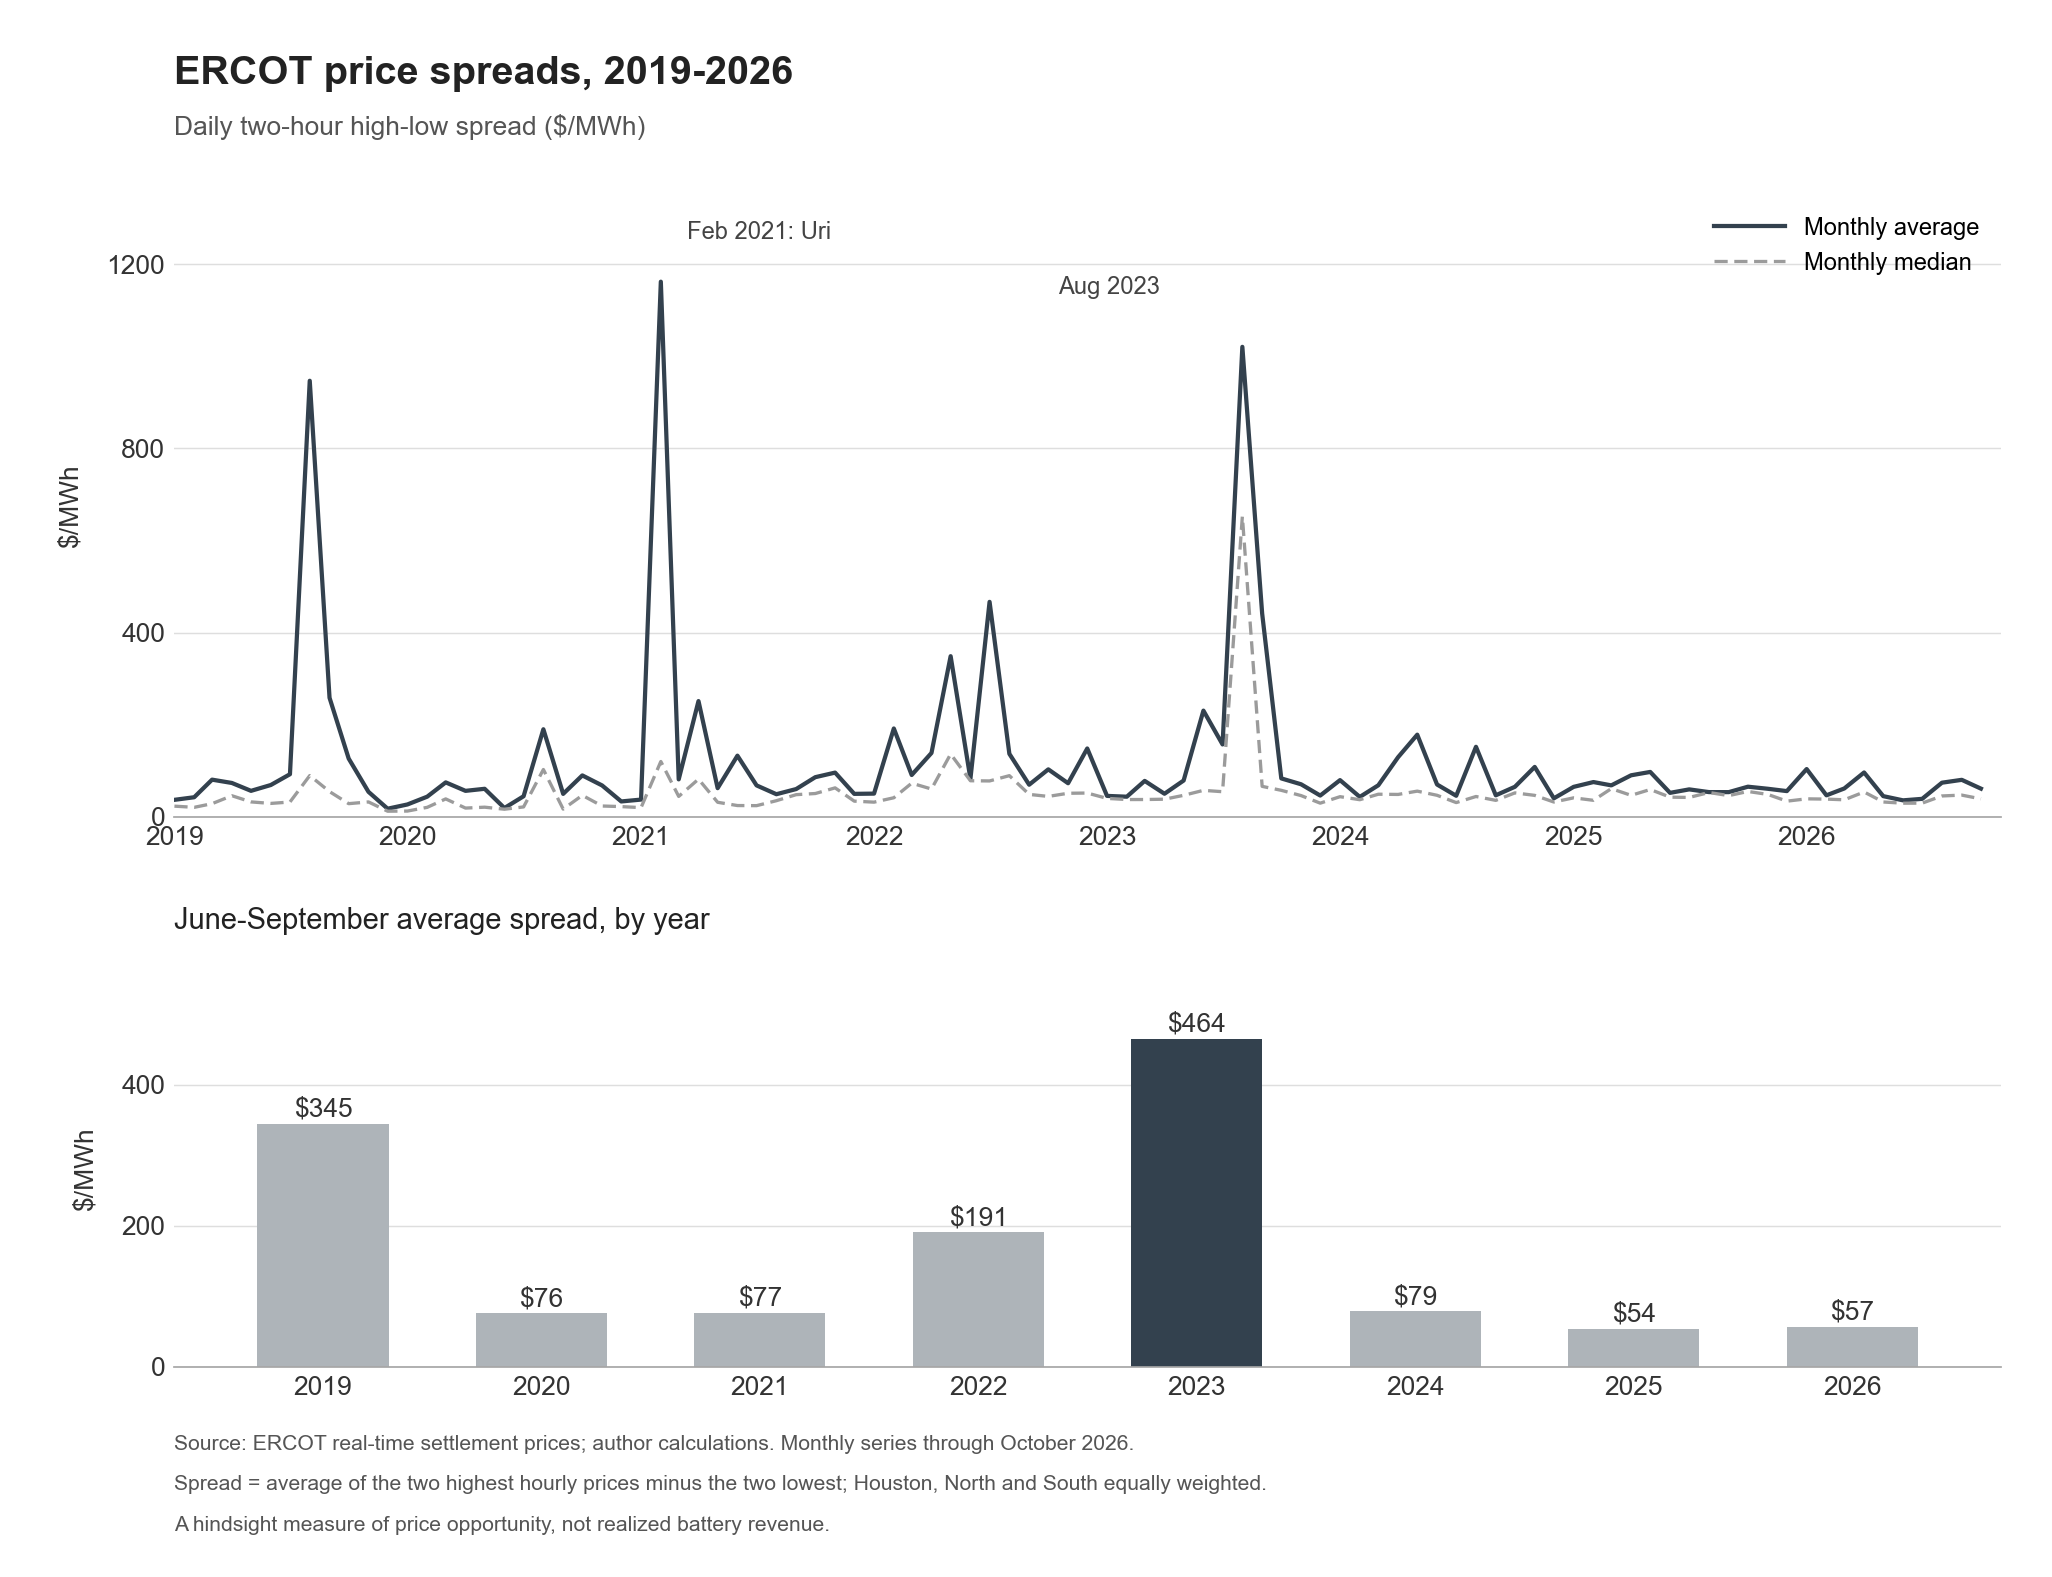
Monthly average and median daily spreads since 2019, with June-September averages for each year. [7] The February 2021 peak coincided with Winter Storm Uri. [8]
The summer average fell from about $460/MWh in 2023 to $57 in 2026, a decline of roughly 88%. The longer history helps put that comparison in context: 2023 was the strongest summer in this sample, while 2019 also had large opportunities.
Extreme days matter disproportionately. Li’s study found that the highest-spread 10% of days accounted for 62% of its total measured spread. Losing those opportunities can hurt much more than a modest change on an ordinary day. [6]
Weather and the rest of the supply mix still matter
Battery growth is not the only thing changing. Hot weather raises air-conditioning demand; generator outages reduce available supply; wind and solar output change throughout the day. Transmission bottlenecks can also leave one area short of power even when supply is available elsewhere.
Summer 2023 combined extreme heat and record demand with a change in reserve procurement. ERCOT introduced the ERCOT Contingency Reserve Service (ECRS) that June. Its independent market monitor argues that keeping too much capacity aside for ECRS created additional energy-price spikes, even when overall reserves were adequate. That is another reason to be cautious about using 2023 as a baseline. [9]
Natural gas prices matter because gas plants often set electricity prices. But Li’s paper notes that its arbitrage benchmark fell between 2023 and 2025 even as average Henry Hub gas prices rose about 40%. [6]
Li also cautions that batteries and solar were built out together, making their separate effects difficult to isolate. [6]
3. What happens next? Timing is hard to know
I suspect volatility will return at some point. Electricity still has to be supplied when people need it, storage can cover only a limited period, and most customers do not immediately cut consumption when wholesale prices spike. Heat, outages and unexpected changes in renewable output can still strain the system. Chris Gillett’s explanation of electricity volatility is a useful guide to those underlying constraints. [10]
Vermillion’s model points to a substantial recovery around 2029-30 as demand grows relative to available supply. He argues that weak revenues are making projects harder to finance and beginning to slow development. Retirements of older generators could also tighten the system. I would treat the timing as a scenario, but their modeling approach provides a useful framework for thinking about what could happen. [5]
Demand: Estimate how much electricity customers will need, where and at what hours. Data-center announcements need adjusting for connection dates, gradual ramp-up and on-site generation. Data centers that use their own generators during price spikes reduce demand on the grid, potentially limiting those spikes and the revenue batteries can earn. [5] [11]
Supply: Estimate what gets built or retires, including gas plants, solar, wind and batteries. Costs, financing and construction constraints affect those decisions. Modo links investment choices with modeled grid operations: new supply changes prices, which changes the economics of further construction. [5] [12]
Hourly prices: Model how that grid meets demand through the day, accounting for renewable output, outages, generator costs, battery charging and discharging, and transmission limits. When cheap supply is sufficient, prices can remain low. When it is exhausted or cannot reach customers, more expensive supply is needed and prices can jump. Additional batteries can narrow those differences by moving energy between hours. [13] [14]
The final spread calculation is straightforward: take each day’s two highest hourly prices minus its two lowest, using the sums, then aggregate across the year. The chart in Section 2 shows an average hourly price gap; Modo’s TB2 measures the opportunity from two hours of trading. The difficult part is forecasting the hourly prices that feed it. This measures an idealized energy-trading opportunity, separate from ancillary-service revenue. [15]
Modo’s central forecast for North Hub puts annual TB2 opportunity near $120/kW-year around 2031, before settling toward roughly $70-80 later on. Around that peak, the scenarios span roughly $75-150/kW-year, with more gas construction at the low end and stronger demand at the high end. [16]
Weather adds another uncertainty. Modo uses a synthetic year assembled from historical months, repeated across forecast years. Different weather could bring a strong revenue year sooner or leave the market subdued for longer. [13]
I find the case for an eventual recovery plausible. I am much less sure when it happens, or whether future revenues resemble the exceptional opportunities of 2023.
4. What does this mean for Base?
Base is private, and the public sources reviewed here do not show its current trading income or company-level profitability. Dell’s $40/kWh-year assumption was a modeled ten-year average. We do not know how it compared with Base’s realized income at the time of the interview, or where that income stands now. [1] [17]
Lower costs can offset weaker trading income
Dell’s July 2025 illustration put all-in installed cost, including customer acquisition, at about $10,000. Subtracting a simplified 30% tax credit and a $500 customer payment left $6,500 of capital to recover. Annual retail margin and subscription payments contributed roughly $200 each, with another $1,200 from trading a 30 kWh battery at $40/kWh-year. That implied about four years of simple payback. He also described reducing installed cost to $8,000 and eventually $6,000 through successive hardware generations and more in-house design and manufacturing. [1] [17]
The table holds his other assumptions fixed and varies installed cost and trading income. The tax credit falls with cost, leaving net capital of $6,500, $5,100 and $3,700 across the three columns.
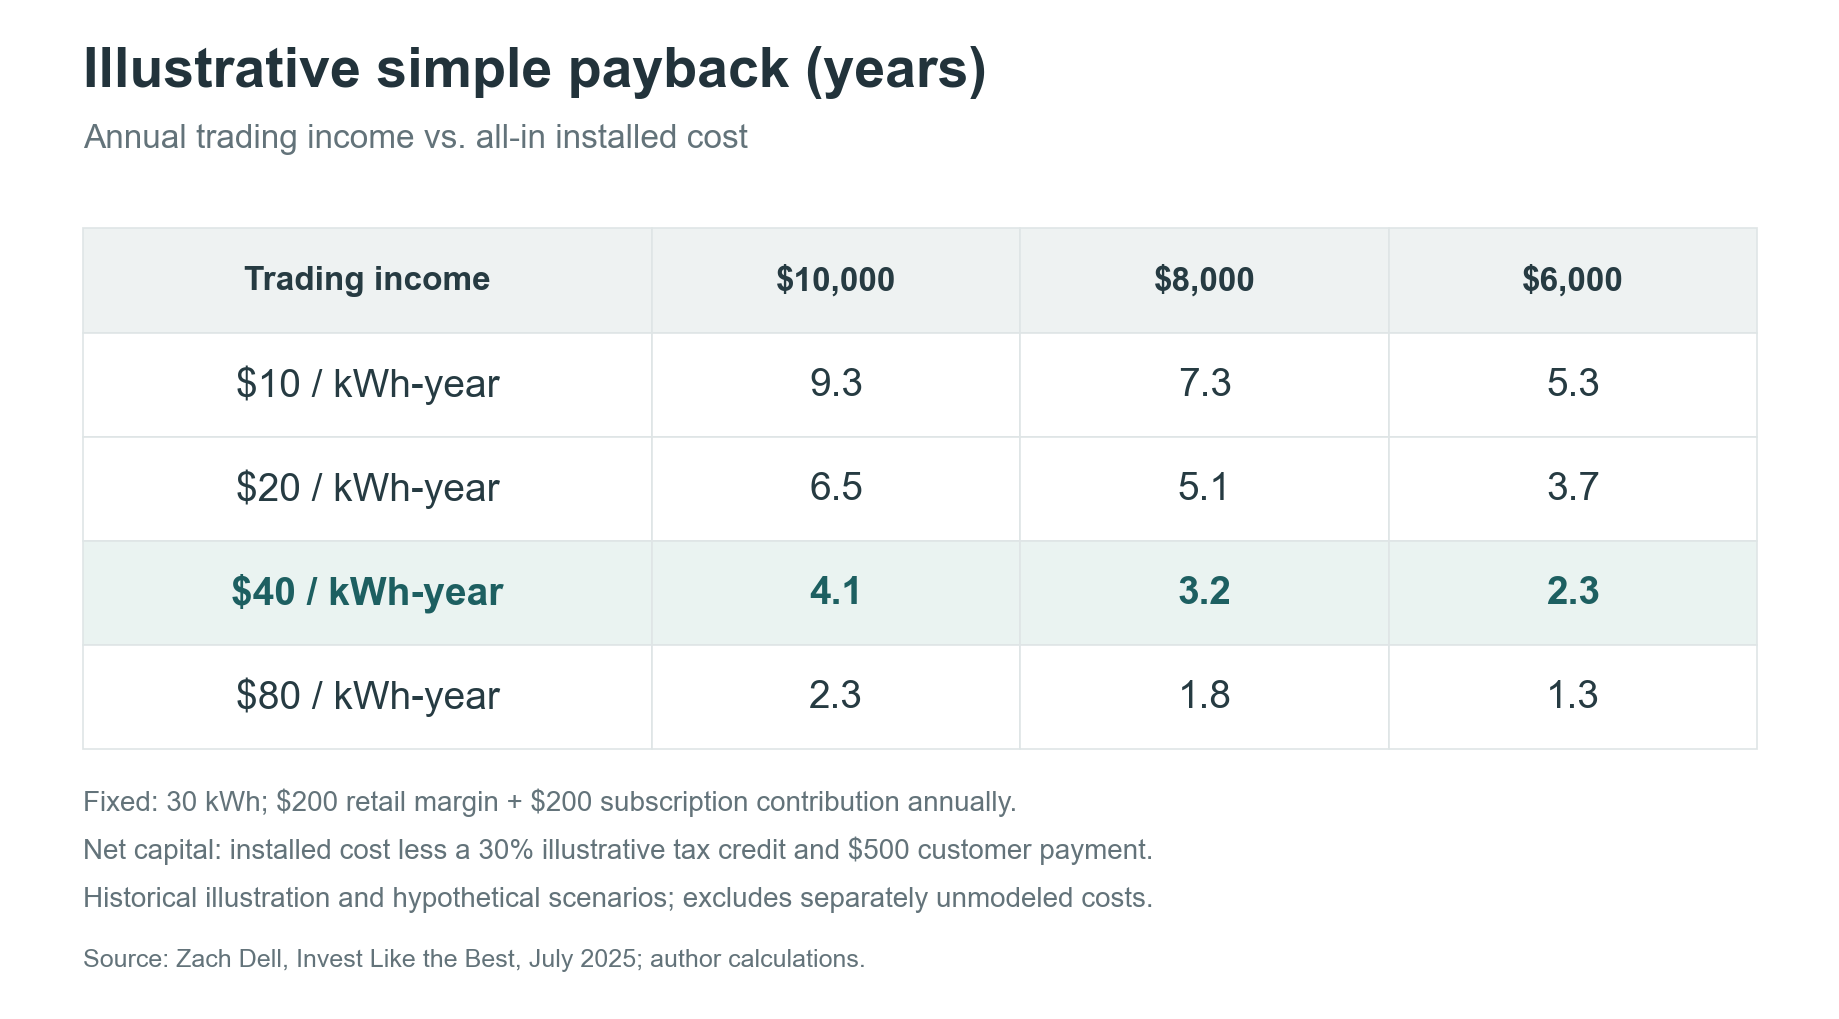
Illustrative simple payback, assuming the selected annual contribution repeats. The $40 row reproduces Dell’s modeled average; $10 is a lower stress case, $20 his weak-year example, and $80 a stronger case within the roughly $20-$100 range he discussed. The scenarios use the 30% tax credit from Dell’s July 2025 illustration and exclude overhead, maintenance, financing and taxes. [1] [17]
At $20/kWh-year, simple payback stretches to 6.5 years at a $10,000 installed cost, but falls to 3.7 years at $6,000. At $10/kWh-year, the same cost reduction brings it from 9.3 to 5.3 years. Lower costs can therefore offset a substantial reduction in trading income. At $80/kWh-year, simple payback would be about 2.3 years at a $10,000 installed cost and 1.3 years at $6,000.
I find the focus on controllable costs encouraging. It gives Base a way to improve economics while wholesale conditions are weak. Assessing how long it can keep investing through that weakness would require more information about its financials and cash needs.
What is already counted, and what else could contribute?
Energy trading: This is the income varied in the table. In October 2025, Dell said Base maintained a 20% state-of-charge reserve for customer backup, limiting the energy available for trading. [18]
Retail electricity and subscriptions: The roughly $200 of retail margin and $200 of subscription contribution are already included. Base also offers electricity-only plans, and Chase Dowling, Base Power’s Head of Market Operations, says the fleet helps manage procurement across the retail book, including customers without batteries. Dell’s per-battery example does not separately allocate those customers’ margins. Heat can increase both customer consumption and procurement prices; battery output can offset some of that exposure, while hedges address remaining risk. Base’s job postings describe joint management of the retail book and fleet, including pricing, hedging and dispatch. [1] [19] [20] [21]
Ancillary services: Base already has qualified resources for ECRS and Non-Spinning Reserve, which pay for capacity kept available to support the grid. Its April 2026 ERCOT presentation confirms both qualifications. Reserve commitments use power capability and stored energy that could otherwise support arbitrage, so the two revenue opportunities must be optimized together. Dell introduced the $40 assumption as energy arbitrage, but did not clearly establish whether it included future ancillary income. The table adds no separate ancillary uplift. [22] [23] [24]
Utility partnerships: These already exist outside the retail illustration. Dell described Bandera Electric Cooperative paying Base for dispatchability, while Dowling discussed fleets controlled by utilities such as CoServ and El Paso Electric. Utilities can reduce peak costs and defer infrastructure upgrades. [1] [19] Austin provides a concrete example: the City Council approved up to $4.08 million annually for up to 40 MW over ten years. At full contracted capacity, that ceiling equates to $102/kW-year. Austin Energy pays Base for control of the reserved battery capacity and receives the benefit of using it. Base handles installation and maintenance, and contracts separately with homeowners for backup service. [25] [26]
On November 10, CoServ and Base announced an expansion of their residential battery program to 450 MW. Base had installed 75 MW since the March launch, adding approximately 10 MW per month. [27]
Transmission-relief contracts: This remains prospective. Dowling proposes that a data center facing curtailment pay for batteries near the constrained transmission lines. [19]
Market access could also improve the value Base captures. It advocates nodal settlement so batteries relieving local congestion can be paid the local price rather than the broader zone price. In November 2026 comments on ERCOT’s Aggregated Distributed Energy Resource (ADER) pilot, Base accepts zonal payments temporarily while seeking a permanent nodal-settlement framework. Base has also entered Chicago, in PJM, where the mix of energy, reserve and capacity opportunities differs. [19] [28]
Lower installation costs and utility contracts give Base ways to improve its economics through a weak trading market. If volatility returns, the same installed batteries could earn more.
Sources
Karl Li: Battery storage cannibalization of price spreads in ERCOT. See pp. 6-8 and 11-12. Its day-ahead, four-hour spread differs from our real-time, two-hour measure. The 62% statistic describes summed spread opportunity, not realized earnings.
ERCOT real-time settlement prices; author calculations. Each daily spread is the average of the two highest hourly prices minus the average of the two lowest, calculated separately for Houston, North and South and equally weighted. Four quarter-hour prices form each hourly average. Complete months through October 2026; summer comparisons use June-September each year.
ERCOT Independent Market Monitor: 2023 State of the Market Report. Executive summary and printed pp. 23-25. The ECRS price effect is the market monitor’s assessment.
Chris Gillett: Why Electricity is the Most Volatile Commodity
Modo Energy: October 2026 ERCOT scenarios and North Hub forecast. Approximate forecast values read from the North Hub scenario chart, in real 2025 dollars.
ILTB episode 434: timestamped transcript, unit economics around 35:37-41:25.
Zach Dell on Catalyst, October 9, 2025: 20% customer backup state-of-charge reserve.
Chase Dowling, Energy Capital Podcast, September 30, 2026. Proposed transmission-relief funding and Base/Piq modeled Burleson case; prospective commercial model.
Base Power Market Analyst and Power Trader job postings.
Base Power ADER overview, April 1, 2026, slides 8 and 10: reserve qualification and market offers.
Base Power: ADER Phase IV and the capacity crunch, qualification and fleet participation.
ERCOT Nodal Protocols, section 8: ancillary capability and competing energy commitments.
Austin City Council backup: Base battery storage authorization, April 2026.
Austin Energy: Base Battery Storage Agreement Overview, October 20, 2026, slides 2-5.
CoServ: residential battery program expansion, November 10, 2026
Base Power comments on ADER Phase IV, November 4, 2026: nodal dispatch and zonal settlement.